Visualization, Selection, and Analysis of Traffic Flows
Roeland Scheepens, Christophe Hurter, Huub van de Wetering, Jarke van Wijk
Visualization, Selection, and Analysis of Traffic Flows
In IEEE Transactions on Visualization and Computer Graphics xx(y),
(Proceedings of IEEE InfoVis 2015). pdf video presentation
Visualization of the trajectories of moving objects leads to dense and cluttered images, which hinders exploration and
understanding. It also hinders adding additional visual information, such as direction, and makes it difficult to interactively extract
traffic flows, i.e., subsets of trajectories. In this paper we present our approach to visualize traffic flows and provide interaction tools to
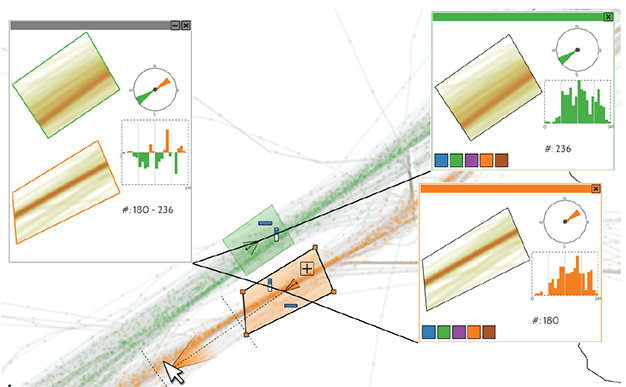
support their exploration. We show an overview of the traffic using a density map. The directions of traffic flows are visualized using a
particle system on top of the density map. The user can extract traffic flows using a novel selection widget that allows for the intuitive
selection of an area, and filtering on a range of directions and any additional attributes. Using simple, visual set expressions, the user
can construct more complicated selections. The dynamic behaviors of selected flows may then be shown in nnotation windows in
which they can be interactively explored and compared. We validate our approach through use cases where we explore and analyze
the temporal behavior of aircraft and vessel trajectories, e.g., landing and takeoff sequences, or the evolution of flight route density.
The aircraft use cases have been developed and validated in collaboration with domain experts.
|